
The objection in 2019 was that Belysa was too small. No MRT at the door, no mall, modest facilities, and the larger projects down the road had all three. The fear was that the big neighbours would carry the area and this one would sit still.
My clients bought it anyway. They had just reached MOP on their 4-room BTO at Costa Ris, sold it, and put the proceeds into a 1,109 sqft three-bedder at Belysa for $950,000.
Seven years later they sold it for $1,590,000. The buyers were a family who chose it because no other block could see into their living room.
With what came back, my clients bought a four-bedder. A bigger home, without dipping into their own savings to get there.
- $47,500 of cash went in in 2019. $493,103 of cash came out in 2026. What CPF was doing in between is the part that matters.
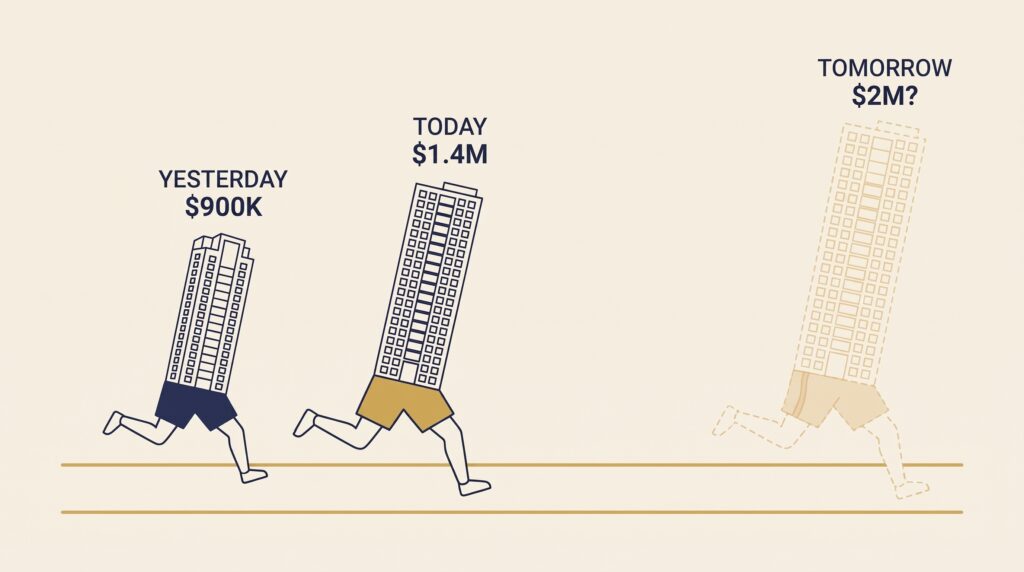
- A three-bedder in the older D17 and D18 condos costs $1.20M to $1.38M today. The same three bedrooms in a new launch nearby costs $2.29M to $2.41M, for 50 to 250 sqft less space.
- On an identical 1,000 sqft, that's $1,201,000 against $2,542,000. More than double.
- Their 1,109 sqft sold for $1,590,000. The same size brand new today costs about $2.82M.
What the same three-bedroom costs now
Take the older condos in District 17 and District 18, everything that got TOP between 2000 and 2015. In Q2 2026 they sold at an average of $1,201 psf. The new launches going up nearby are averaging $2,542 psf.
Now put that into money you can picture. A three-bedder in those older projects usually runs 1,000 to 1,150 sqft, so you're paying somewhere between $1.20M and $1.38M. A three-bedder in a new launch nearby is usually 900 to 950 sqft, and it costs $2.29M to $2.41M.
You pay roughly a million dollars more, and the unit is smaller by anything from 50 to 250 square feet.
| Older resale 3-bedder D17 and D18, TOP 2000 to 2015 | New launch 3-bedder East OCR | |
|---|---|---|
| Usual size | 1,000 to 1,150 sqft | 900 to 950 sqft |
| Price per sqft | $1,201 | $2,542 |
| What you pay | $1.20M to $1.38M | $2.29M to $2.41M |
| Same 1,000 sqft costs | $1,201,000 | $2,542,000 |
Average psf from PropNex Research ProTrend: D17 and D18 condos with TOP between 2000 and 2015, Q2 2026 average; East OCR new launch indicative 2-year transaction band, 3 and 5+ bedroom averages. Usual sizes are our own observation from listings and transactions in the two districts, not a ProTrend figure.
On an identical 1,000 sqft the comparison is cleaner. The older unit costs $1,201,000. The new one costs $2,542,000. Same district, same three bedrooms, more than double the money.
The reason is simple enough. Nobody is going to build those older, larger layouts again at the old price, because land and construction cost what they cost today. Whatever a new unit sells for sets the top of the market. Everything older sits underneath it.
The units that are running out
Underneath that top, one group of units is disappearing faster than the rest.
Go to the oldest end of it and you're looking at projects completed in the early 2000s. Facilities that look their age. Nothing that photographs well for a listing.
The layouts are the bonus. Bedrooms, living rooms and kitchens built to a size nobody builds to now. You're buying floor area at a price that doesn't exist anywhere else nearby.
Units like these are the lowest hanging fruit in the east, and they're the first to go. Big and cheap at the same time, while the new version of the same three bedrooms costs more than twice as much per square foot and hands you less of it.
One client, seven years, every number
No forecasting in this section. This is one client's actual breakdown, from the day they bought to the day the sale completed.
| The entry, 2019 | |
|---|---|
| Property | 3-bedroom, Belysa (EC, Pasir Ris) |
| Floor area | 1,109 sqft |
| Purchase price | $950,000 |
| Entry psf | $857 |
| Cash down, 5% | $47,500 |
| CPF down, 20% | $190,000 |
| Loan, 75% | $712,500 |
| The exit, 2026 | |
|---|---|
| Sale price | $1,590,000 |
| Exit psf | $1,434 |
| Price growth, annualised | 7.6% a year |
| Less the loan still owing | $585,567 |
| Less agent commission and legal | $37,662 |
| Total equity released | $966,771 |
| of that, back into CPF | $473,668 |
| of that, cash in hand | $493,103 |
| Cash originally put in, 2019 | $47,500 |
Loan modelled on a 30-year tenure at an average 2.2%, with every monthly instalment serviced from CPF. Selling costs assume 2% agent commission plus GST, and $3,000 in legal fees. Indicative, not a settlement statement.
$47,500 of cash went in. Seven years later, $493,103 of cash came out.
That's a real number and I'm not going to dress it down. But the $47,500 was never doing the work on its own, and this is the part that catches people out.
Of the $966,771 that came back, $473,668 went into their CPF account, not their bank account. CPF paid for most of this property. $190,000 of CPF went in as the downpayment. Another $227,251 of CPF went in month by month, paying the loan for seven years. The day you sell, CPF takes all of it back, plus the interest it would have earned if you'd left it alone.
So $493,103 was money they could spend. The other $473,668 went back into a pocket they can use for the next property and nothing else.
Here's the whole trail, if you want to check it.
| Where the paper gain went | |
|---|---|
| On paper they made | $640,000 |
| The bank took, in interest over seven years | $100,318 |
| The agent and lawyer took | $37,662 |
| CPF took back as accrued interest | $56,417 |
| Cash gain, on top of the $47,500 they put in | $445,603 |
$47,500 plus $445,603 is the $493,103 cash in hand above. The CPF portion is close to a wash: they took $417,251 out of CPF over the seven years and put $473,668 back, which is roughly what it would have grown to had they never touched it.
This is where a lot of upgraders get caught. They see the sale price, they see what's left after the bank, and they start planning renovation, furniture, maybe a car. Then the lawyer's letter arrives and half of it has gone back to CPF. The money is still theirs. It just can't pay a contractor.
Work out both numbers before you commit to anything. Not only what the place will sell for. What will actually land in the bank.
Where their $1,590,000 sat in the market
At 1,109 sqft, the older resale condos in those two districts would have valued their unit around $1.33M. They got $1,590,000. A 2018-era launch of the same size was reselling for $1.81M to $1.84M. And brand new, the same 1,109 sqft costs about $2.82M today.
They sold above the old stock and below the newer stock. Every one of those four figures is checkable.
Profit is determined at purchase, not at sale.
They didn't time the market. They bought the right layout, in a stack with unblocked views, at a price below the bigger projects around it. Those three things are what a buyer paid for seven years later.
The 2026 buyers were HDB upgraders finishing MOP, wanting to be closer to their parents in Pasir Ris. By the time they reached Belysa they had viewed most of the condos across Tampines and Pasir Ris, and the same thing kept happening. The blocks sat too close together. Stand at the living room window and you're looking straight into someone else's. For a family that had decided an unblocked view was non-negotiable, almost every unit they saw was a no.
Then they walked into Belysa, and nothing was looking back at them.
The very thing the 2019 buyers were warned about, a small project with fewer blocks and less around it, is what gave their unit a buyer.
The tipping point
No read on the market is bulletproof. Here's what would turn this one around.
If a new launch nearby came in at $1,700 to $1,800 psf, the whole thing changes. What holds the older units up is the price of new. If new gets cheaper, the older units don't rise to meet it. The top simply comes down, and an older unit stops looking cheap next to anything.
That's a long way from where we are. Pinery Residences at Tampines Street 94 launched on 29 March 2026 and sold 544 of its 588 units that weekend, at an average of $2,546 psf. Tampines launches are running $2,500 to $2,700. To reach $1,800, prices would have to fall 28 to 37% depending which end of each range you take. Call it a third.
Launch prices don't fall on their own. They fall when land gets cheaper. So government land sale results around here are the thing to watch.
Why a district average can't tell you much
That $1,201 average covers fifteen years of buildings across two whole districts. It can't tell you what your unit is worth. Your block, your floor, your size, your facing, all of it moves the number, and none of it shows up in an average.
Belysa sat inside that average. So did every other unit in the project. What sold this one was the view out of the window.
What has your stack actually sold for?
If you own one of these, the number that decides your exit isn't the district average. It's what units like yours have sold for in the last six months. Same stack, same size, same floor. And whether anyone is still out there who can pay it.
Send me your block and unit type and I'll pull the recent sales.
Client identity withheld. Property type, floor area, transaction prices and analytical structure are real. Accrued interest estimated on all CPF used, downpayment and monthly instalments both, at the prevailing OA rate over the holding period; the actual figure depends on individual contribution timeline. Loan figures modelled on a 30-year tenure at an average 2.2% and assume every instalment was serviced from CPF. Cash and CPF splits are indicative, not a settlement statement. Holding power stress-tested at 4% over a 30-year tenure. Resale and new launch psf are transaction averages sourced to PropNex Research ProTrend, not valuations of any specific unit; typical unit sizes for three-bedroom units in these districts are our own observation from listings and transactions. Pinery Residences launch-weekend figures are as publicly reported for 29 March 2026. Any forward-looking comment here reflects how supply and the cost of new housing work, not a forecast of transacted prices.
Heikal Shafrudin · Associate Group District Director · PropNex Realty, Singapore · CEA Reg No. R016820G