
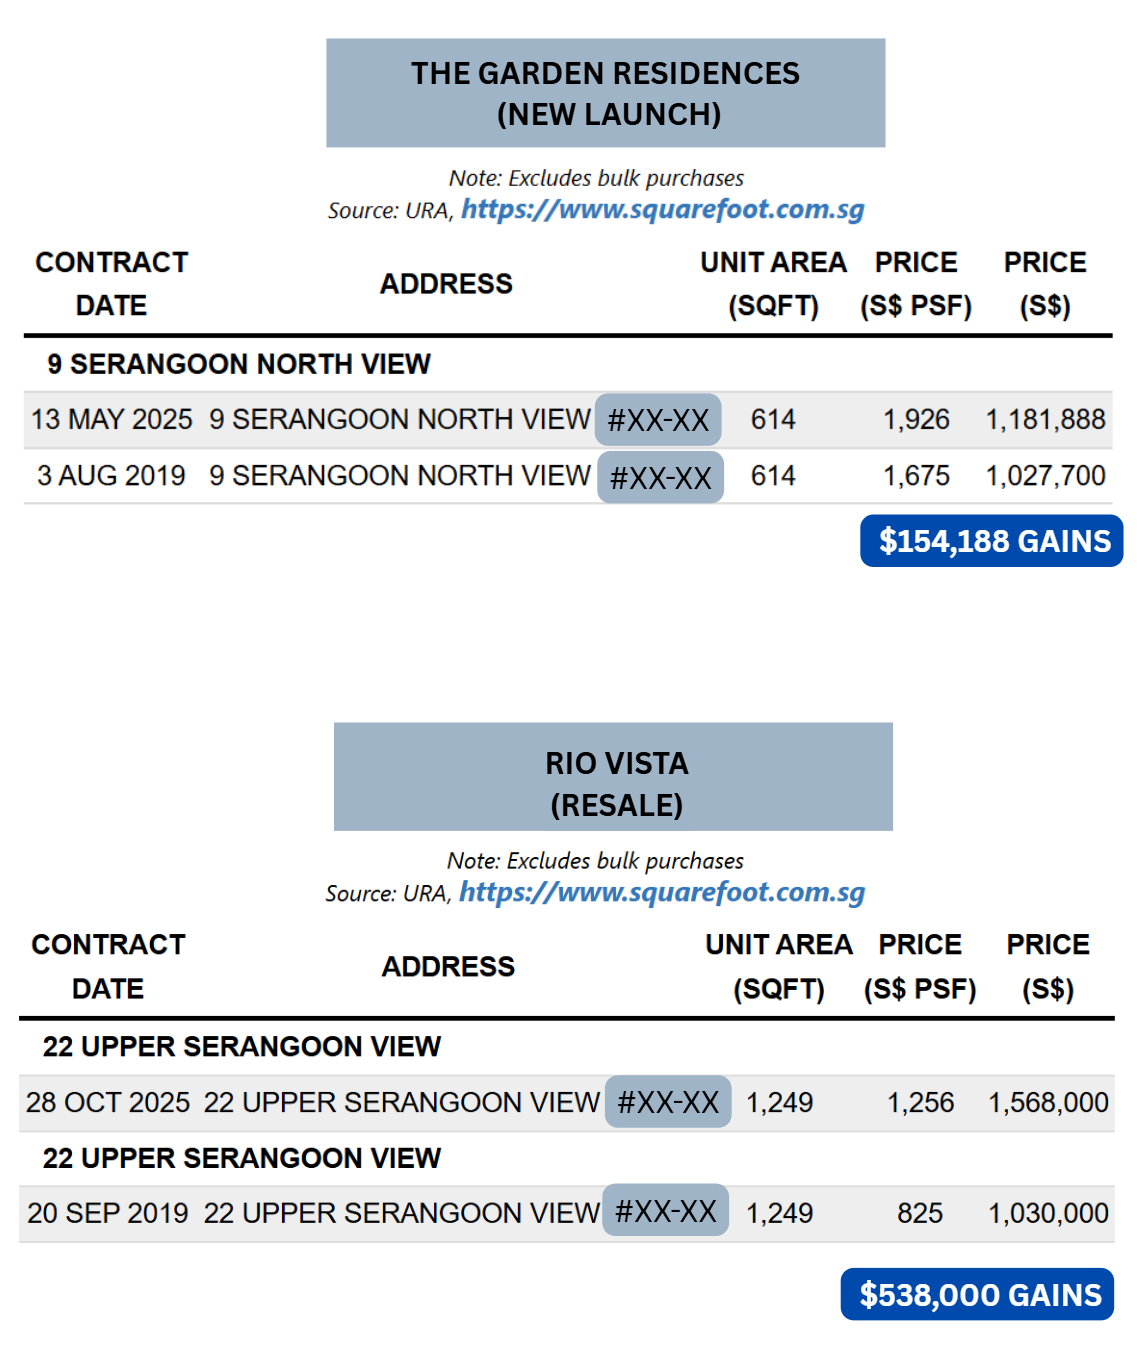
In 2019, someone bought a 614 square foot unit at The Garden Residences in Serangoon for $1,027,700.
That same year, about fifteen minutes away in Hougang, someone bought a 1,249 square foot unit at Rio Vista for $1,030,000.
Purchase price was just $2.3k difference. Same district. Same year.
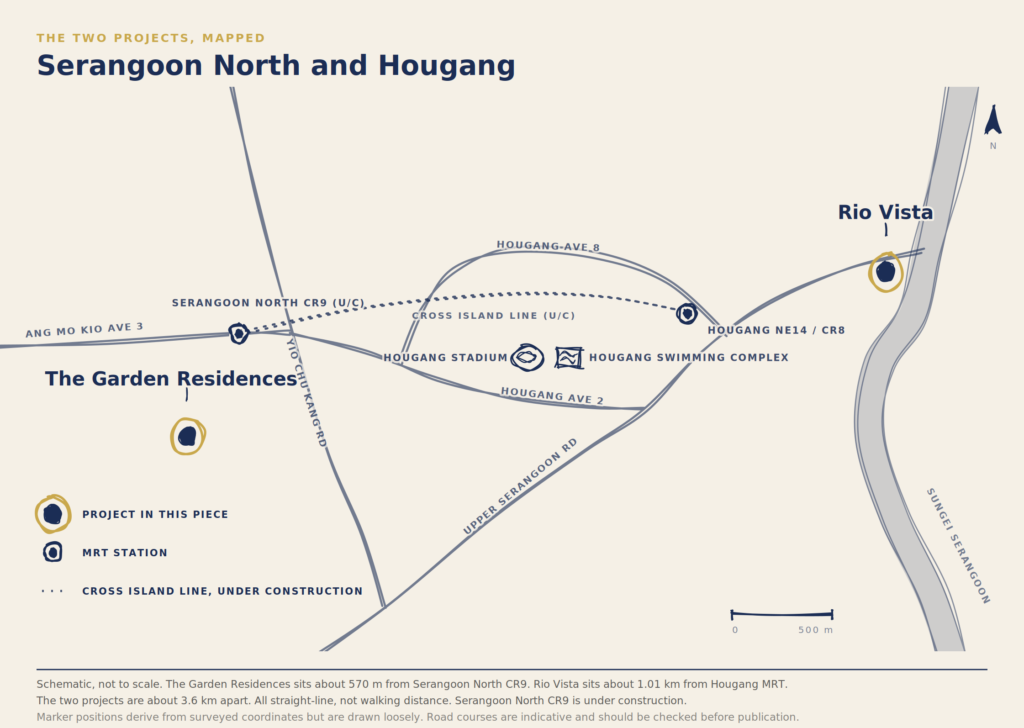
Where the two units sit
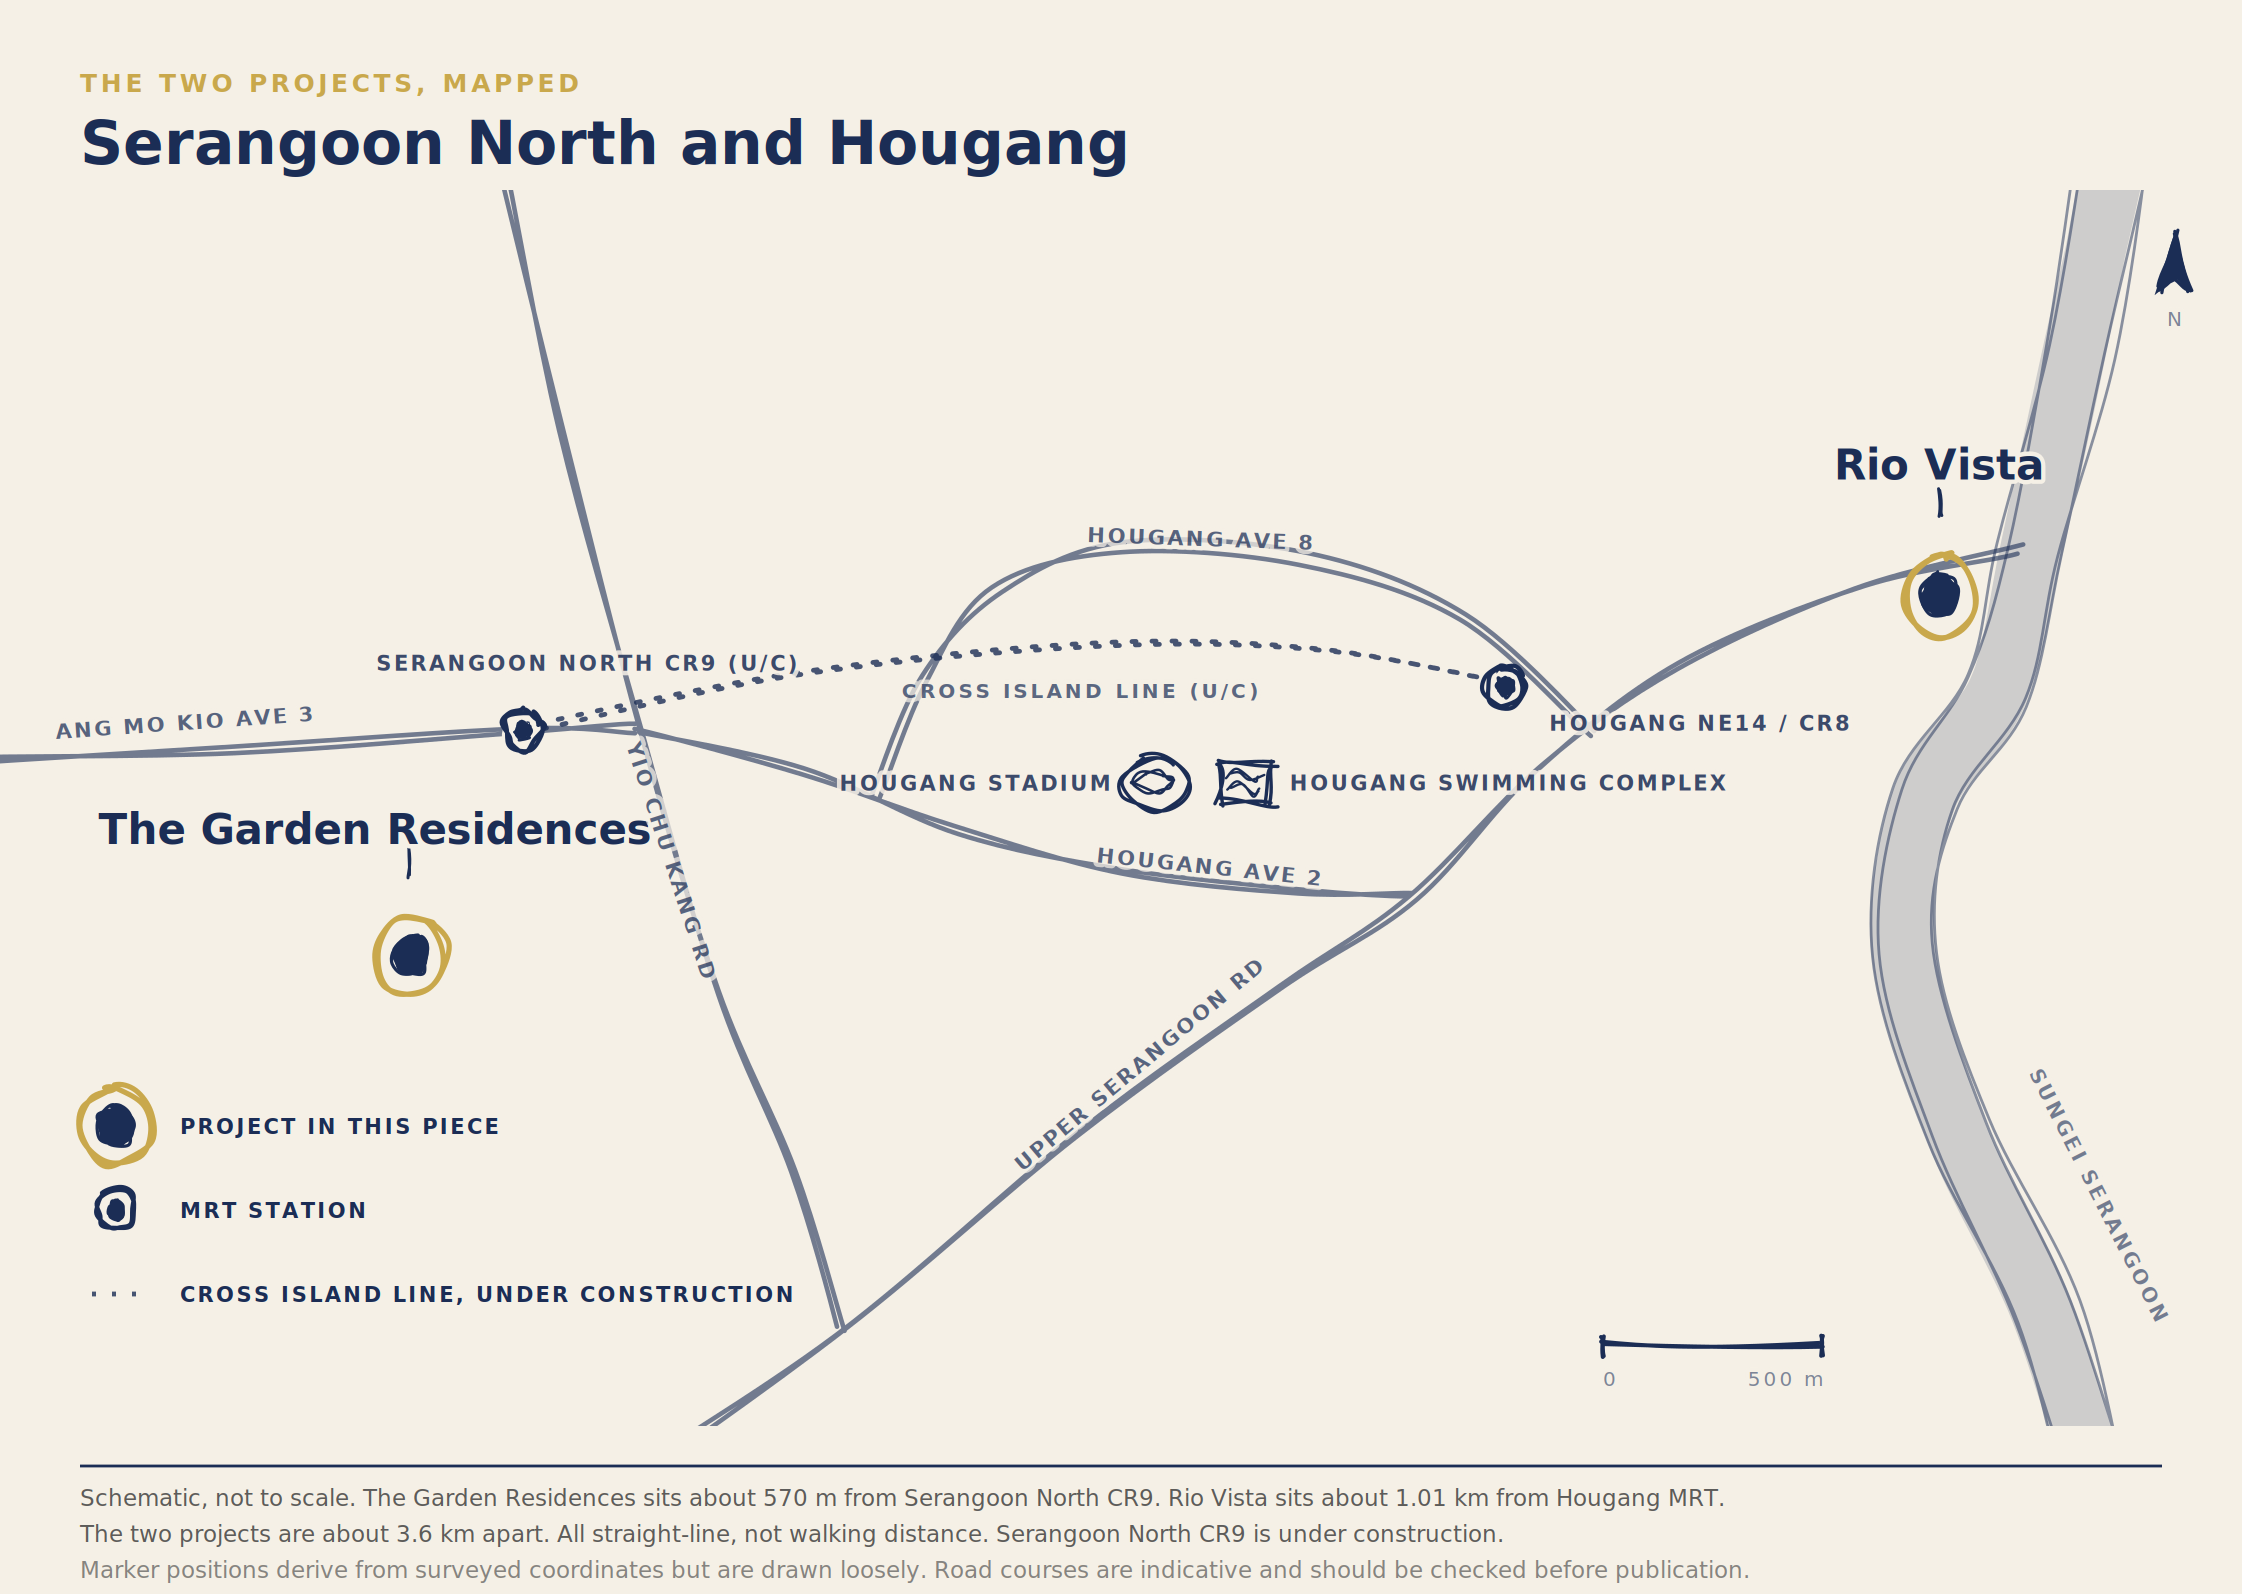
One was a new launch, bought from the developer. The other was an older resale, in a development completed in 2004.
Both units were re-sold in 2025.
The Garden Residences unit sold for $1,181,888. Gross gain of $154,188.
The Rio Vista unit sold again for the 4th time for $1,568,000. Gross gain of $538,000.
Same money in. Six years. A gap of $383,812.
See What The Same Money Bought.
ps. Both videos show the same exact layout and condo, but not the exact unit. They were presented by other agents, and the videos does not belong to me. I am linking them because the difference is easier to see than it is to describe.
First, the 1,249 square foot layout at Rio Vista.
Video by SG Property TV and Pauline Chia. Not our listing and not the unit in this article.
Then the 614 square foot two bedroom at The Garden Residences.
Video by PropSuites, for listing agent Vinod. Not our listing and not the unit in this article.
Same budget, same year. For $2.3k more, you got the brand new 2br in The Garden Residences.
My research proved my own thesis wrong, it’s not age, it’s not whether you’re the first or second owner… it’s something else.
- Two units bought in 2019 within $2,300 of each other, same district. Six years later they were $383,812 apart.
- We researched 25,872 matched repeat sales, split into two seven-year stretches that overlap only on 2017 purchases.
- Age made no difference. Resale beat new launch in one stretch and lost in the other, so that one is about timing, not who you buy from.
- Units under 750 sqft had the worst profits in all time windows we researched.
The Three Theories.
Every upgrader I sit with has heard some version of these.
Age. “New is safer. Old developments decay, the lease runs down, no buyer will buy from you.”
Resale versus new launch. Buying at new launch means paying the developer's margin, his marketing cost, and the land price at the top of a cycle. Buying resale means paying all that, plus someone else’s profits.
Which generation of owner you are. The first owner takes the hit. The second owner buys clean. By the third or fourth, the price has found its level.
I’ve heard variations of all three claims on youtube by other agents and creators. So I built the dataset to test them properly, expecting to confirm what I already thought.
Two theories were debunked by the URA transaction data.
How I Tested It.
Project-level averages are almost useless for this question, because they mix launch prices and resale prices together and the step between the two is enormous. So I matched individual units instead.
I took 71,061 URA caveats across 78 developments and matched them by block and unit number, so I could see when it was purchased, and when it was sold. That gave 25,872 pairs. Each pair is one owner's full hold: what he paid, what he sold for, how long he held. Some units were resold multiple times over the years.
Group one: bought 2017 to 2019, sold 2024 to 2026. 2,519 pairs, median hold 6.6 years.
Group two: bought 2015 to 2017, sold 2021 to 2024. 2,507 pairs, median hold 6.4 years.
One thing to be clear about. Every figure here is a gross gain: sale price minus purchase price, before stamp duties, loan interest, property tax, maintenance, agent commission and renovation.
Age.
Resale buyer against resale buyer, same years, split by when the development was built.
| Development completed | Pairs | Median gross gain | Bought 2017–19 | Bought 2015–17 |
|---|---|---|---|---|
| 2000 or earlier | 105 | $410,000 | 6.02% | 3.75% |
| 2001 to 2008 | 111 | $497,000 | 6.15% | 3.64% |
| 2009 to 2016 | 109 | $478,000 | 6.61% | 4.31% |
Median gross gain shown for the 2017–19 buyers. Annualised medians computed per pair, then taken as the median across pairs.
Oldest to newest: 6.02% a year against 6.61%. Half a percent differentiates 2 condos built 25 yrs apart. What’s worse, The 2015–17 buyers had lower annualised profits, yet the same tight margins.
A 1996 condo and a 2014 condo, bought by resale buyers in the same year and sold later in the same year, produced returns you would struggle to tell apart. Age is not doing the work.
I had already expected that a property’s youthfulness wouldn’t dictate the profit it gets. But the next two points, were news to me.
Resale Versus New Launch.
Start with the 2017–19 buyers.
| Bought as | Pairs | Median gross gain | Annualised |
|---|---|---|---|
| New launch | 2,168 | $347,500 | 4.46% |
| Resale | 331 | $462,000 | 6.20% |
Resale buyers earned $114,500 more, at 6.20% a year against 4.46%, over the same holding period.
That is the article I thought I was writing. It confirms what I have been saying. It would have made a good headline.
Then I ran the 2015–17 buyers.
| Bought as | Pairs | Median gross gain | Annualised |
|---|---|---|---|
| New launch | 2,120 | $362,425 | 5.40% |
| Resale | 366 | $236,000 | 3.75% |
It reverses. Completely. New launch buyers ahead by $126,425 and 1.65 percentage points.
Same method, same projects, same matching. Different seven years.
URA caveat records via Square Foot Research, August 2026 export
The explanation is not complicated once you look at when those launches were priced. The 2015 to 2017 launches were sold during an oversupply market that followed the 2013 cooling measures. Developers were cutting prices and running discounts month after month to clear stock. Those buyers entered cheap and rode the 2021 to 2024 run.
The 2017 to 2019 launches were priced off the en-bloc land spike, when developers had paid record prices for sites and passed that through. Those buyers entered expensive.
So the honest finding is this.
Whether resale beats new launch depends almost entirely on where in the cycle the developer set his price.
Neither New Launch nor Resale is safer by nature. It comes down to what the developer sells to the public in the year you happened to buy, and you only find out who came out ahead six or seven years later, when both have sold. There may be signs of overpriced or underpriced developer sales, but there’s no 100% way to know it when you’re buyin.
1st Owner, 2nd Owner, 3rd Owner.. Does It Matter?
This one falls with the last, and for the same reason.
| Owner | Bought 2017–19 | Bought 2015–17 |
|---|---|---|
| First, bought at new launch | 4.46% | 5.40% |
| Second | 5.77% | 3.61% |
| Third | 6.16% | 3.57% |
| Fourth and beyond | 5.80% | 3.92% |
Each row here is built on somewhere between 29 and 106 units. That is thin. Don't read the exact percentages, and don't read which way they point either.
Among the 2017–19 buyers, every resale generation beats the first owner. Among the 2015–17 buyers, every resale generation loses to him.
Eventually I realised there wasn’t enough units in the market sold multiple times for this to be a meaningful comparison. But I had to research this as there’s a ‘school of thought’ that believes one should never buy from the 2nd.. 3rd..4th Owner… Be the 1st owner only..”
What Survived.
One thing did not move.
New launch purchases, by unit size:
| Unit size | Bought 2017–19 | Bought 2015–17 |
|---|---|---|
| Under 750 sqft | 3.33% | 3.29% |
| 750 to 1,000 sqft | 5.58% | 6.31% |
| 1,000 to 1,300 sqft | 6.32% | 6.57% |
| 1,300 sqft and above | 5.78% | 6.27% |
Units < 750 square feet returned 3.33% for the 2017–19 buyers and 3.29% for the 2015–17 buyers. Two separate seven-year stretches over 1,539 units. Different interest rates, different cooling measures, different launch pricing, different everything.
But just less than 0.4% difference between the two time windows.
URA caveat records via Square Foot Research, August 2026 export
Over roughly 6.5 years, the median under-750 new launch purchase among the 2017–19 buyers gained $183,000. The median 1,000 to 1,300 square foot unit, also bought at new launch, over the same years, gained $555,749. Three times as much.
The resale side shows the same shape:
| Unit size | Bought 2017–19 | Bought 2015–17 |
|---|---|---|
| 750 to 1,000 sqft | $347,000 | $131,000 |
| 1,000 to 1,300 sqft | $463,000 | $237,000 |
| 1,300 sqft and above | $680,000 | $370,000 |
Median gross gain in dollars, not annualised. The two groups are not comparable on level, only on shape.
Every step up in size is a step up in profit margins, in both time windows, whether you bought new launch or resale.
One thing tho, the size comparison above is too wide. If we do a 150-200sqft gap comparison, you'll see an even clearer picture that 3 bedders above 950sqft would be where profit margins start to pull away from the smaller units.
Thanks to this finding, I did a deeper dive and I came up with this article: Part 2, Same 3br, Same Price, But 300sqft Bigger↗.
Three theories tested. Two collapsed. The one nobody sells you on is the one that held.
Why Size Does This.
Two reasons. One of them isn't in the research above.
Everything above is selling price minus purchase price. Rent is not in any of it, and it can't be: URA's rental records don't carry a unit number, so there's no way to tie a unit's rent to that same unit's sale. I'm using market ranges below, not matched data, and I'll flag them as such.
Rent against the loan.
For an investor who never moved in, rent decides how long you last.
Strong rent and you hold through year six and year seven without thinking about it. Weak rent and you're topping up the mortgage out of pocket every month, and a vacant second year is usually when people decide to sell.
A 620 square foot unit in the outside central region rents for roughly $2,700 to $3,300 a month. A 1,200 square foot unit in the same estates rents for roughly $4,000 to $4,400.
Both might have cost you around $1.1 million. Both carry a similar mortgage. One brings in $1,300 a month more against the same repayment. Over six years that isn't a rounding difference. It's the difference between a tenant covering most of your interest and a tenant covering a fraction of it.
That gap doesn't appear in any table above. It appears in whether you were still around to sell in 2024.
Who buys it from you.
A 620 square foot unit sells to a single buyer, a couple with no children, or an investor. That's a real pool but a narrow one, and it's the pool most sensitive to interest rates and to sentiment.
A 1,200 square foot three bedroom sells to a family. Families move for schools, for a second child, for a parent who needs a room. They move whether or not the market is exciting.
A 1,200 square foot three bedroom at Pinevale, Tampines, completed 1999. This is the space the 614 does not have, and the reason its buyer pool for this resale is larger.
When you exit in year eight or nine, you are not choosing your buyer. You chose him six years earlier, when you picked the floor area.
One Thing I Can't Fully Separate.
There is a hole in this and I'd rather point at it myself.
Small units and new launches are hard to pull apart in this data. Almost every unit under 750 square feet in the sample was bought new, from a developer. Sub-750 resale stock barely existed in 2017. Those units hadn't been built and lived in long enough to come back onto the market yet.
So a fair question is: am I measuring small, or am I measuring new launch?
Two things make me think it's size.
It shows up among resale buyers too. Look at the resale table again: same climb by floor area, and every buyer in it bought resale. New launch isn't in that comparison at all.
And it shows up in both stretches, including the one where new launch beat resale. If the small-unit result were really a new launch result in disguise, it should have flipped when the new launch result flipped. It didn't.
That isn't proof. It's the best caveat data can do, and anyone who tells you their property numbers give them a clean answer here is either not looking or not telling you.
What This Leaves Me With.
Three theories. Two collapsed. What I'm left with is less than what I went in hoping for.
Age tells you nothing worth acting on. A 1996 development and a 2014 development, bought and sold in the same years, came out the same. Stop using build year to pick.
New launch against resale is a timing question, and you can't time it from where you're standing today. Whichever one you buy, you'll find out in year seven whether the developer's pricing that year was kind to you. Neither is the safe option.
Floor area is the only one of the three that held. Both stretches, both ways of buying, every way I cut it. On finer bands the curve climbs to around 950 square feet and then goes flat.
That's the whole finding. It's not clever and nobody is selling it to you, because there's no commission in telling someone to buy fewer, bigger units.
If you already own a unit, send me the block, the unit number and the year you bought. I will pull your own matched pair out of the same caveat set and tell you where it sits on this curve.
One Question.
Back to where this started. The Garden Residences at 614sqft, Rio Vista at 1,249sqft. In 2019, the price gap: $2,300. In 2025, the price gap: $383,812.
It is tempting to read that as new against old, because one completed in 2021 and the other in 2004. On this dataset that reading does not hold up. Age failed the test. New launch against resale failed it twice, in opposite directions. What is left is the 635sqft vs 1,249sqft.
I spent a long time on this because I wanted a rule I could give my clients. What I got instead was two of my own beliefs failing a second test, and one variable that would not move no matter how I work it.
If you own a unit now, or you are about to buy one, you already know that size reigns over all..
The question to ask, is not whether you bought new or old, or whether you were the second owner or the fourth.
It is what happens in year eight, when you want to sell, and you have to work out who is standing in front of you.
Appendix: Method And Limitations.
Source. URA caveat data exported through Square Foot Research, six workbooks, August 2026.
Sample. 78 developments, 71,061 caveats. Four contribute no matched pairs to either group: Parc Central Residences and Tembusu Grand completed too recently, Pinevale and Regent Park have too few caveats in the export period. The working sample is 74 developments.
Matching. Transactions matched at unit level by block number and unit number. Consecutive transactions on the same unit form one pair. Pairs with a hold under 1.5 years are excluded, to remove flips and address errors. 25,872 pairs in total.
Periods. Bought 2017 to 2019 and sold 2024 to 2026, 2,519 pairs. Bought 2015 to 2017 and sold 2021 to 2024, 2,507 pairs. The two overlap only on 2017 purchases.
Measure. Median gross gain and median annualised return, computed per pair and then taken as the median across pairs. Medians throughout rather than means, because a handful of penthouse and jumbo transactions distort averages badly at this sample size.
Limitations.
- New launch pairs outnumber resale pairs roughly six to one. That reflects the market rather than the method, but it means the resale figures move more with small changes in approach.
- Which generation of owner is undercounted. For older developments the export window starts mid-life, so genuine fourth and fifth owners are invisible. The generations reported are the ones traceable, not the ones that exist.
- Repeat-sale matching only captures units that sold twice inside the export period. Long-term holders are excluded by construction, and they are plausibly the better-performing group.
- The two groups differ in composition. The 2017–19 buyers lean toward private new launches that became transactable in that period. The 2015–17 buyers lean toward executive condominiums crossing their minimum occupation period. That difference is part of why new launch against resale flips, and it is a reason to treat that question as unsettled rather than answered in either direction.
The 74 developments.
Affinity At Serangoon · Aquarius By The Park · Arc At Tampines · Austville Residences · Bellewoods · Casablanca · Casafina · Castle Green · Changi Rise · Compass Heights · Costa Del Sol · Cote D'Azur · Dairy Farm Residences · Eastpoint Green · Eastvale · Esparina Residences · Evergreen Park · Grandeur Park Residences · Guilin View · Kandis Residence · Kovan Melody · La Casa · Lilydale · Livia · Melville Park · Mi Casa · Midwood · Northoaks · Northwave · NV Residences · Orchid Park · Palm Gardens · Parc Botannia · Parc Clematis · Parc Esta · Parc Life · Parc Vista · Regentville · Riverfront Residences · Rio Vista · Rivervale Crest · Savannah Condopark · Seaside Residences · Sengkang Grand Residences · Signature At Yishun · Simei Green · Sims Urban Oasis · Symphony Suites · The Alps Residences · The Bayshore · The Brownstone · The Criterion · The Eden At Tampines · The Esparis · The Florence Residences · The Florida · The Garden Residences · The Jovell · The Quartz · The Quintet · The Rivervale · The Santorini · The Tapestry · The Tropica · The Visionaire · The Wisteria · Treasure At Tampines · Twin Vew · Waterfront Isle · Waterview · Whistler Grand · Whitewater · Woodsvale · Yishun Emerald
Heikal Shafrudin, PropNex Realty, CEA Reg No. R016820G
This article discusses historical transaction data and is not a forecast. Past transaction outcomes do not indicate future results. Figures are gross gains and exclude stamp duties, financing costs, taxes and transaction expenses. Every figure is sourced from URA caveat records and can be produced on request.